So having physically built my GPU server, I wanted to test it out. One of the things I’ve not been able to do before is graphical machine learning, such as converting text to images, with the additional resources, I’d give it a go.
I searched around and found an excellent tutorial by Daniel, I followed the write up and it worked first time out the box. I was soon creating amazing images on the P100.
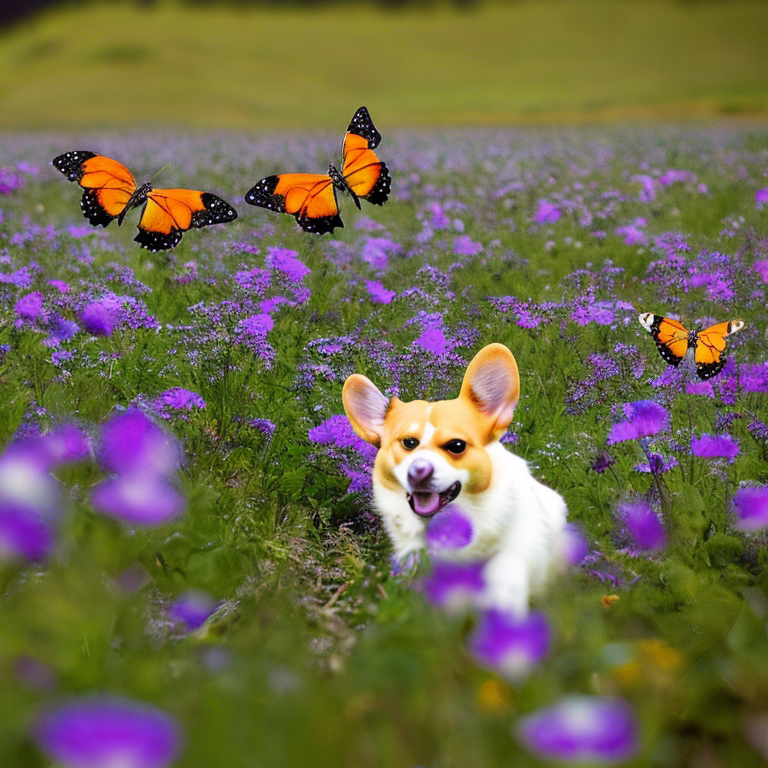
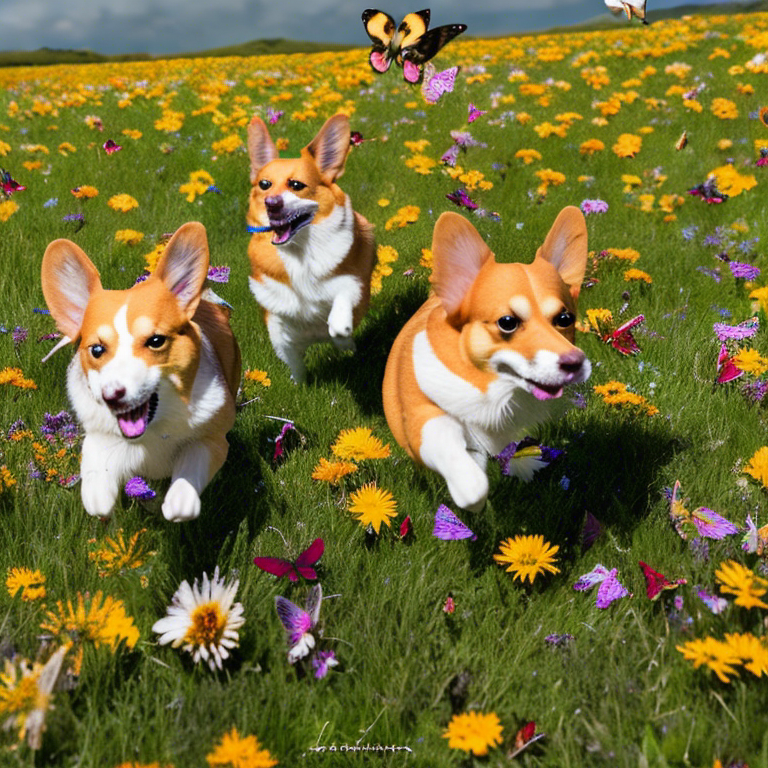
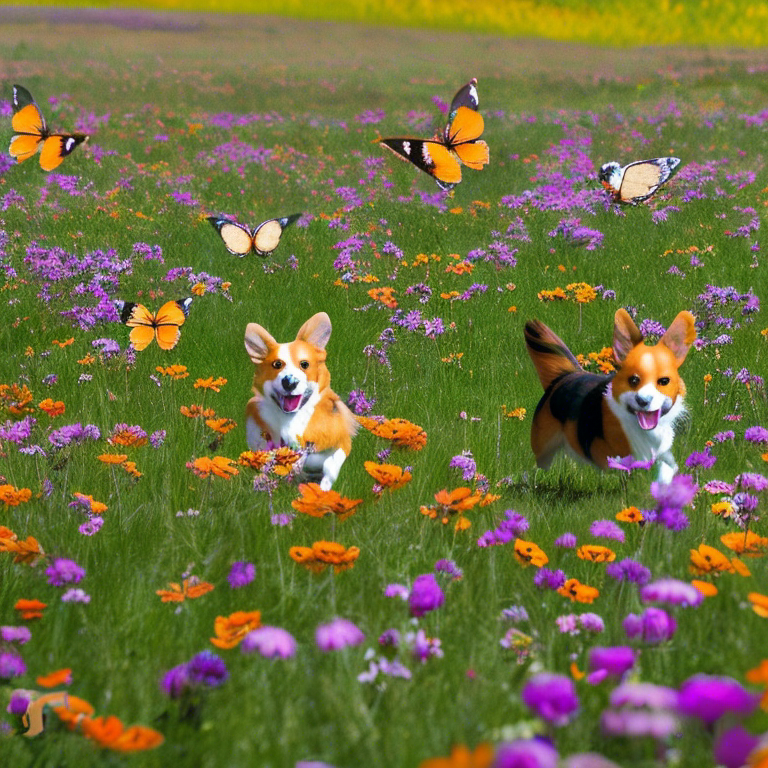
‘professional photograph of corgis chasing butterfly in a field of flowers’
I am use to using ‘nvtop’ for real-time monitoring which does an excellent job of capturing the load/temp of the GPU’s.
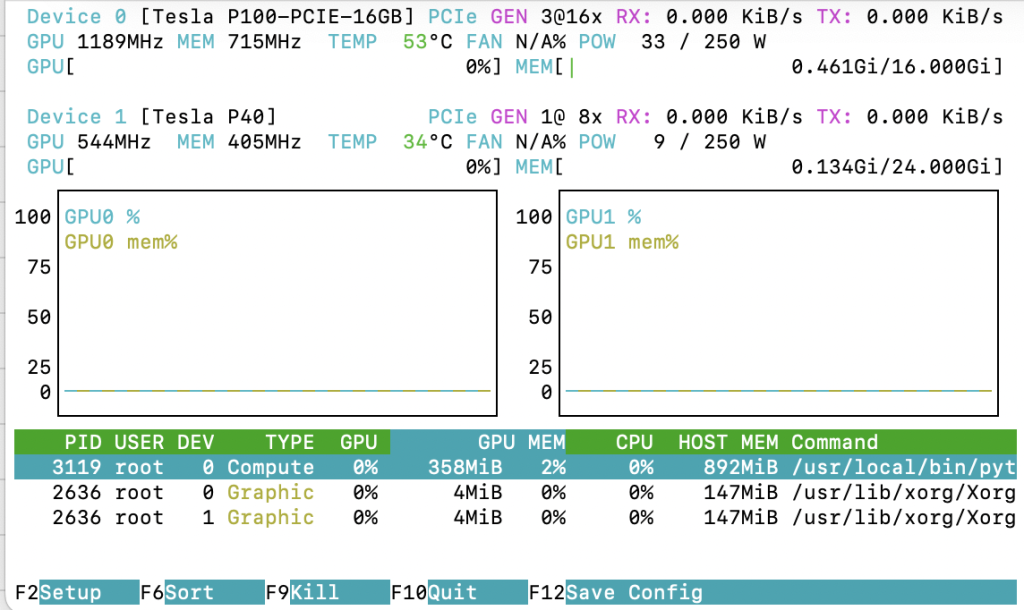
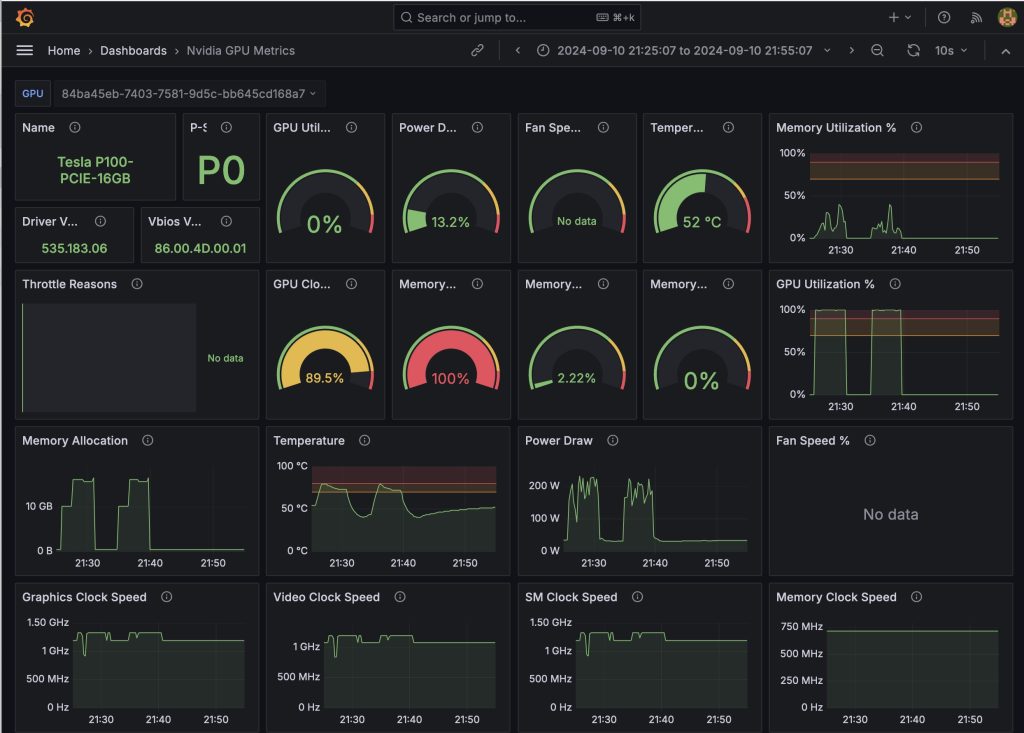
But as a fan of graphics, I wanted something a little more. Now whilst I’m a big fan of MRTG and in the past have written my scripts to scrape the values from nvidia-smi, tools such as Grafana & Prometheus provide excellent dashboards.
I started with an excellent tutorial by Hitesh, here, which got me the basic Grafana and Prometheus setup. With that, it was a simple exercise to follow the tutorial here by Didar and to start pulling data from the nvidia GPU’s.
I set about rendering some new pictures via stable diffusion and was really impressed with the monitoring dashboard for my GPUs.
I’m now going to add more dashboards/alerting, then start work on my ‘slurm’ gpu cluster so i can distribute jobs over the various GPU’s I have available to me.
I dare say that I will soon be back to doing more academic work once on cryptanalysis in the coming weeks, but I have found this a very pleasant distraction in the mean time 🙂
One Response